> For the complete documentation index, see [llms.txt](https://docs.yellow.pro/llms.txt). Markdown versions of documentation pages are available by appending `.md` to page URLs; this page is available as [Markdown](https://docs.yellow.pro/portfolio/portfolio-overview.md).

# Portfolio Overview

A single, consolidated view of your entire Yellow\.pro account. Spot and perpetual equity side by side, with the metrics that matter at a glance.

The Portfolio Overview page brings your whole account into one screen so you can see your total value, this month's performance, and how much risk you're carrying, without switching between the Spot and Perpetual views.

## Unified Equity Display

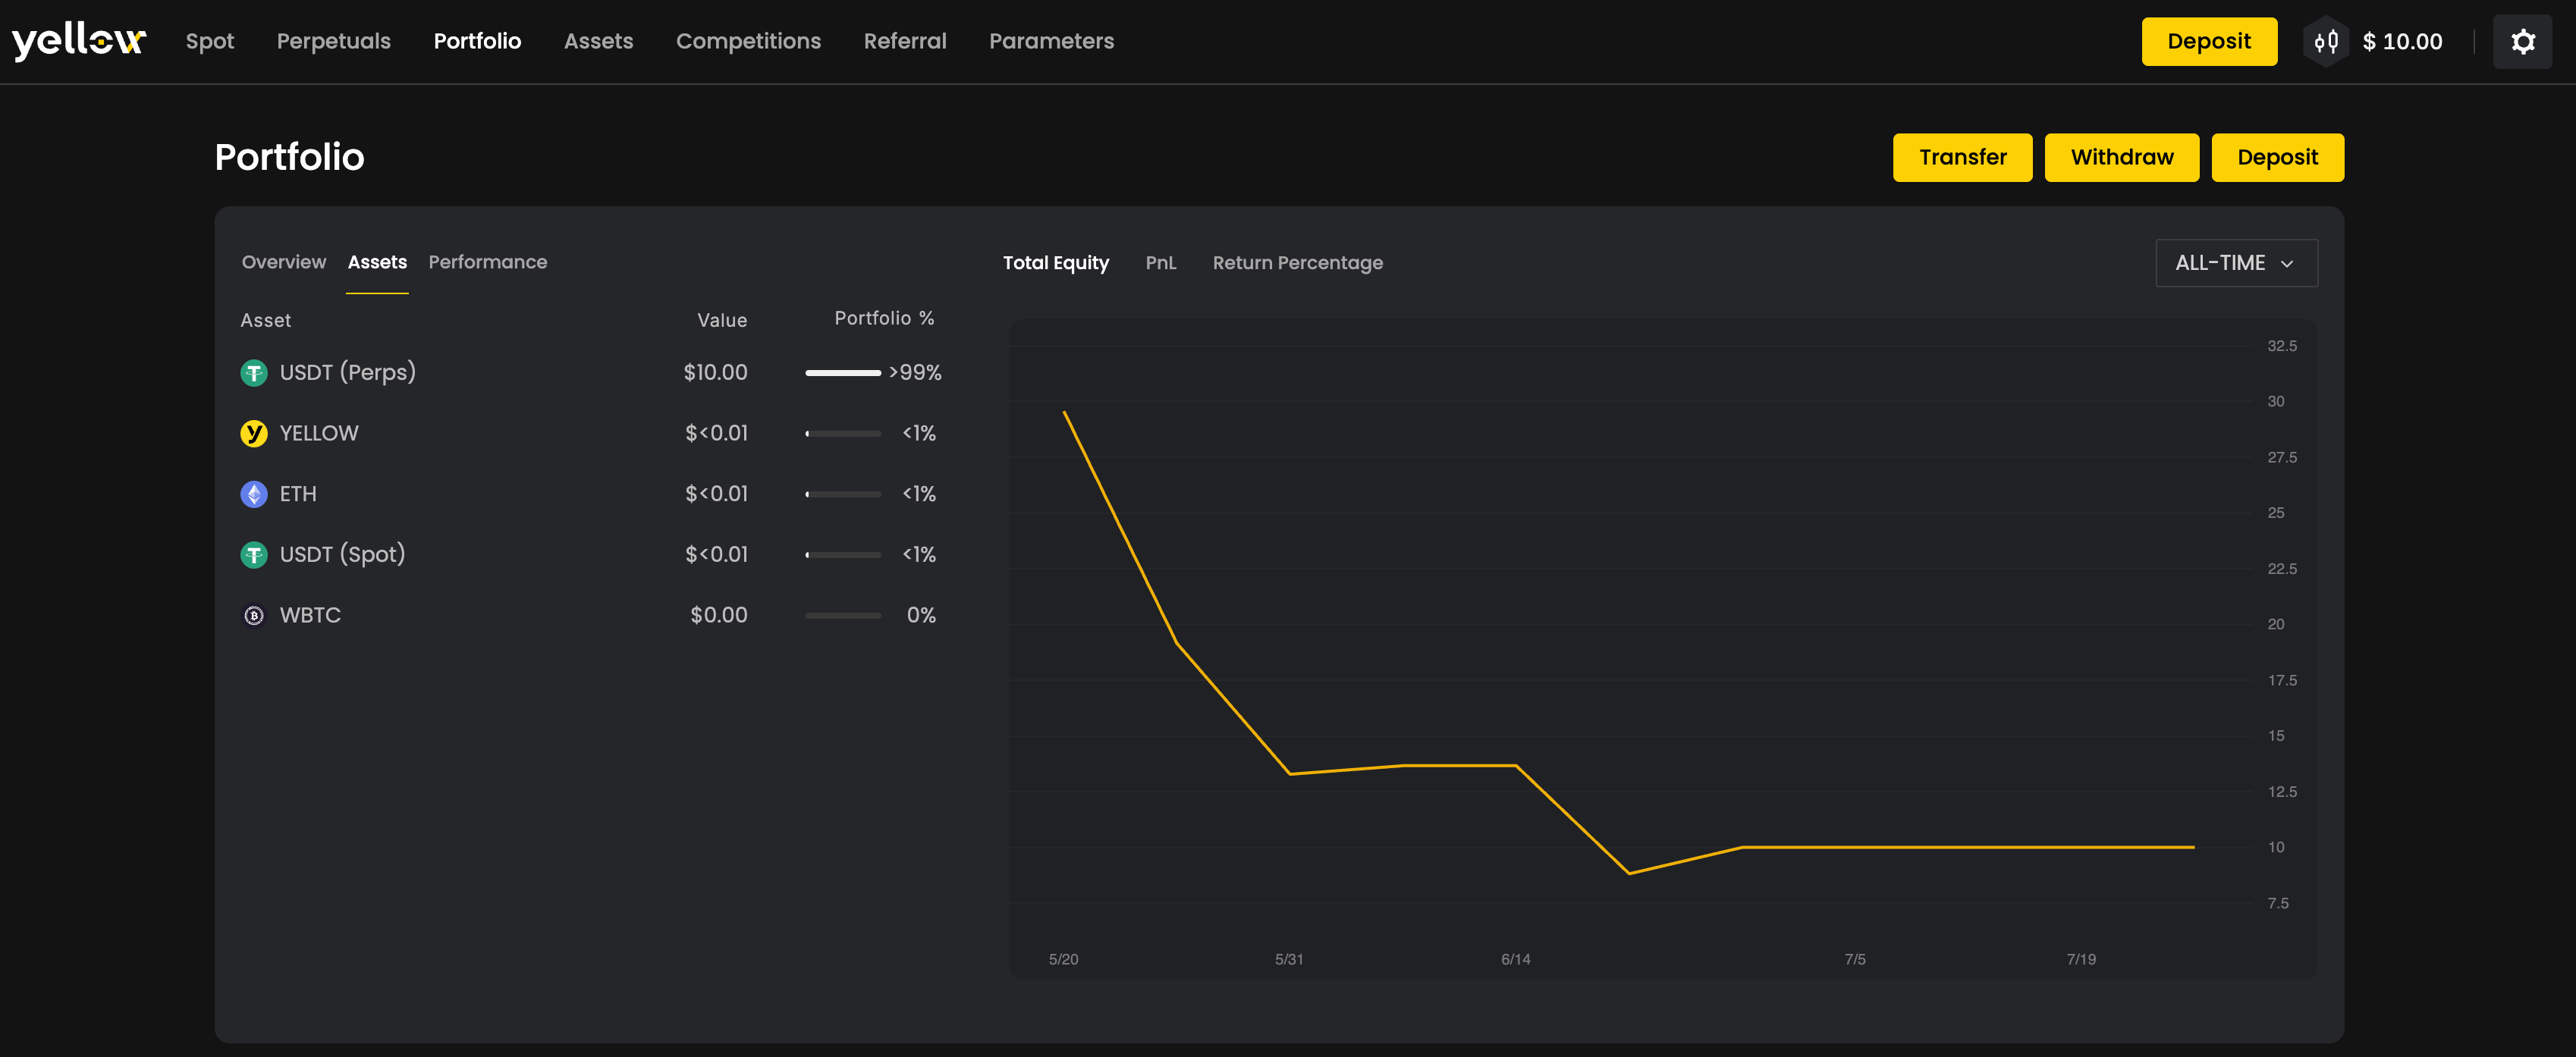
Your **total equity** is shown across both your Spot and Perpetual accounts, broken down by asset class and updated in real time. This is the single number that answers "how much is my account worth right now?", combining available balances, funds in open orders, and the value of open perpetual positions.
<figure><img src="/files/nnZk3sx4SvOhC03Xgs7E" alt=""><figcaption></figcaption></figure>

## Monthly Performance

A set of key performance indicators (KPIs), all scoped to the **current calendar month**, so you can track how you're doing without the noise of older activity:

* **Realized PnL** — profit or loss from positions you've already closed this month.
* **Unrealized PnL** — current profit or loss on positions still open.
* **Net funding** — funding fees paid or received on your perpetual positions.
* **Open positions** — how many positions you currently hold.
* **Leverage in use** — how much leverage your open positions are applying.
* **Win rate** — the percentage of your closed positions this month that were profitable.

{% hint style="info" %}
Monthly KPIs reset at the start of each calendar month. To review activity from previous months, use the [Position History](broken://pages/4708a1d97d64dd4a535765cf47577b84d1dcb08f) tab.
{% endhint %}

## Risk Snapshot

Alongside your perpetual overview, the page shows your **cross-margin ratio** and **maintenance margin** so you can see how close you are to liquidation before it happens. Watching these two figures is the simplest way to stay ahead of margin risk.

For a full explanation of how these values are calculated, see [Cross-Margin Risk & ADL](/perpetual-trading/risk-and-liquidation/cross-margin-risk-and-adl.md).

## Win-Rate Tracking

Every closed position is automatically classified as **winning** or **losing**, and the page keeps a rolling **win-rate percentage** for the month. This gives you an at-a-glance sense of how consistently your closed trades are working out, independent of the size of any single trade.

## Related Articles

* [Position History](/perpetual-trading/position-management.md)
* [Understanding Your Balances](/account-and-balance/understanding-your-balances.md)
* [Understanding PnL](/perpetual-trading/pnl.md)
* [Cross-Margin Risk & ADL](/perpetual-trading/risk-and-liquidation/cross-margin-risk-and-adl.md)
